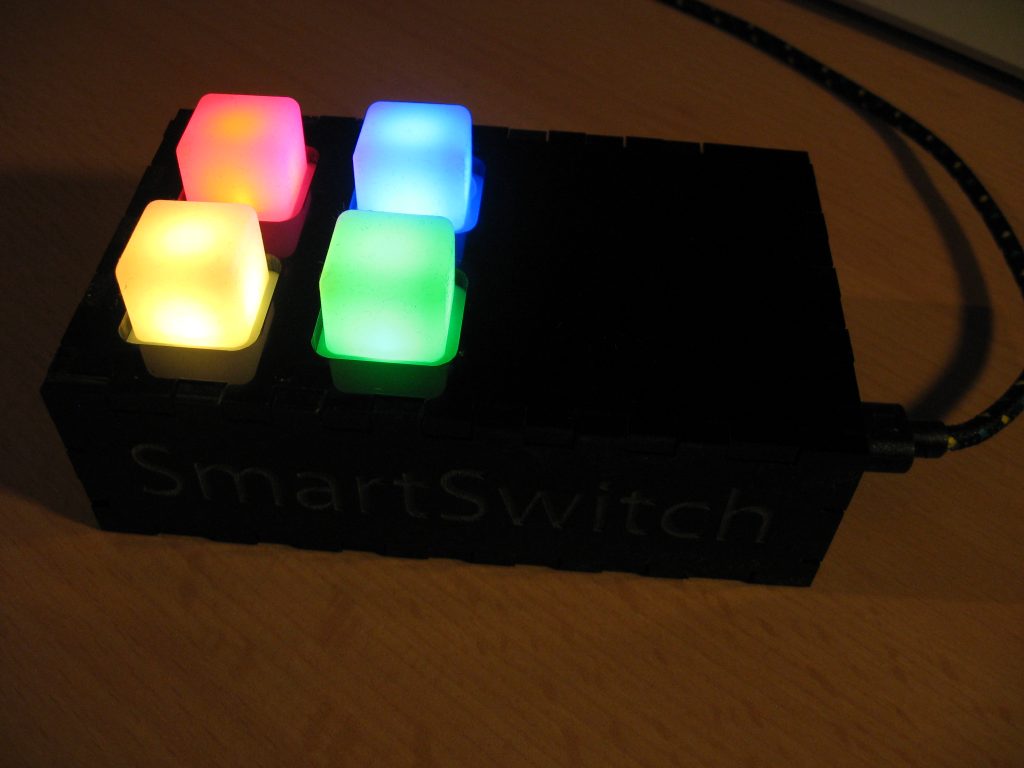
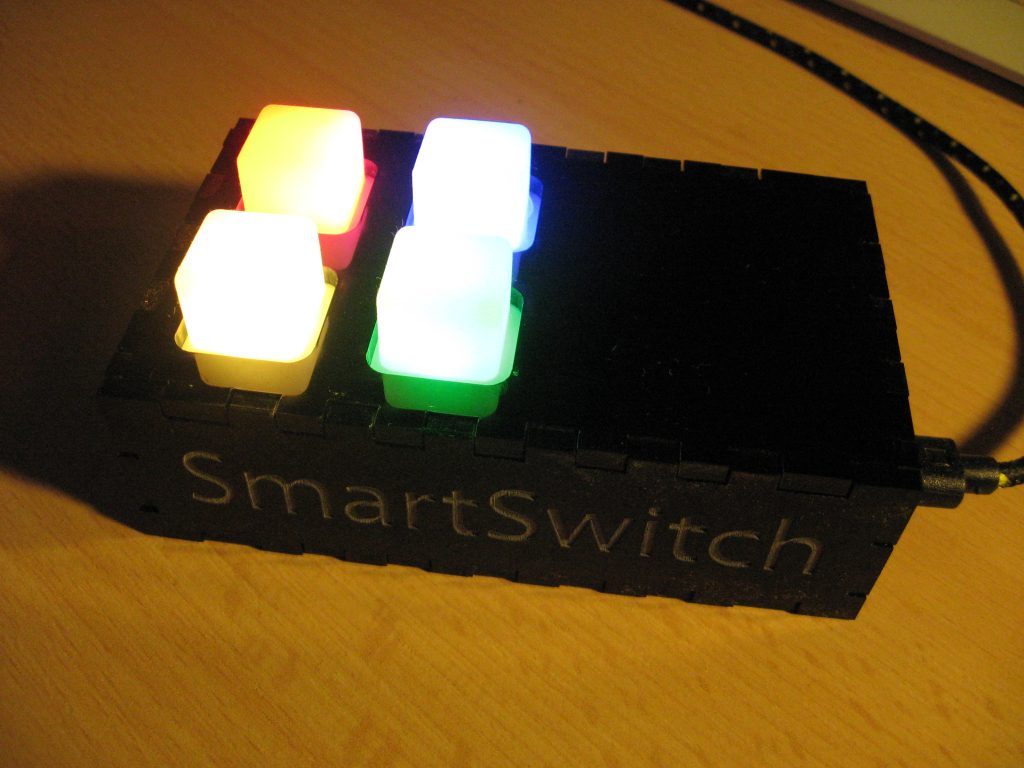
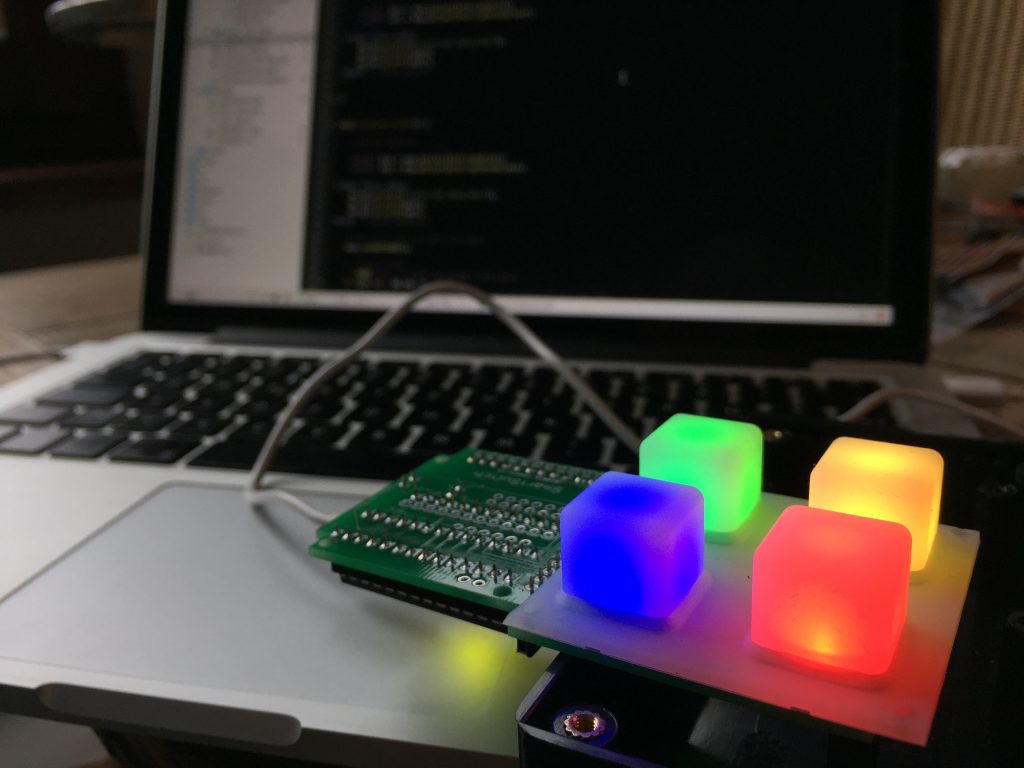
During the wintersemester 2014/2015 Phil and I developed a SmartSwitch with a Spark.Core in “Embedded Systems”.
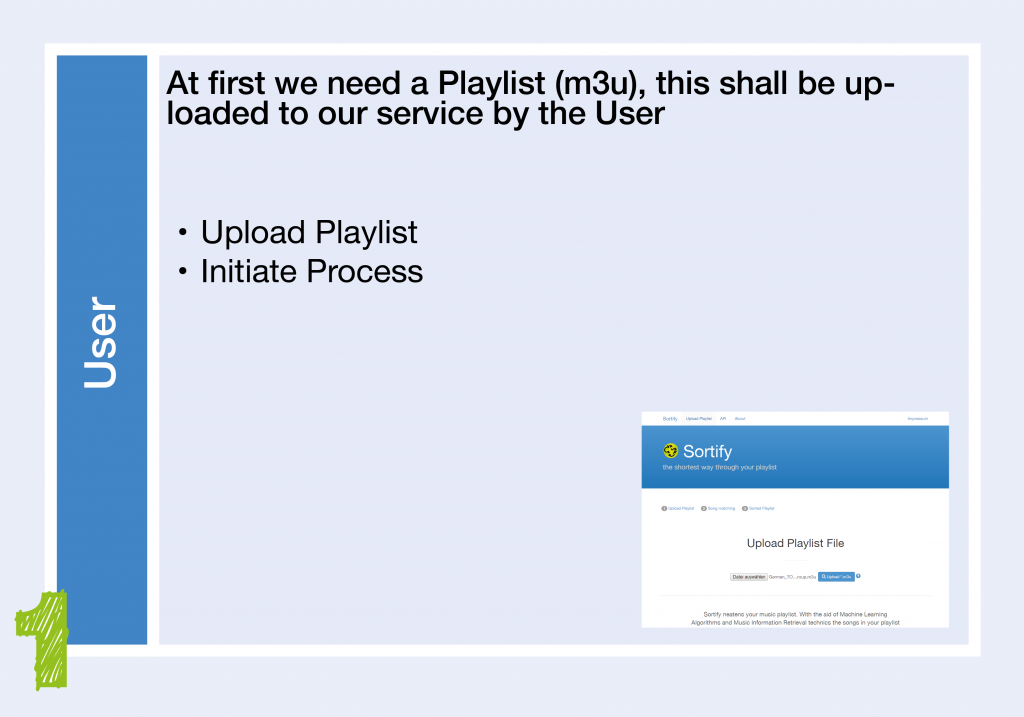
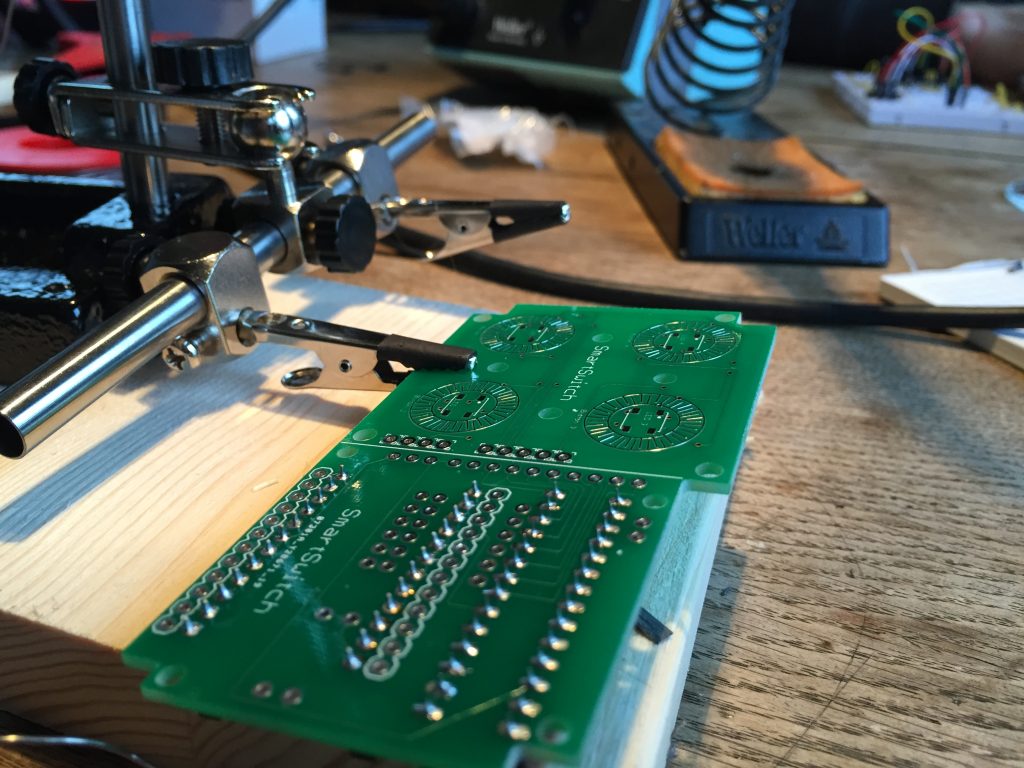
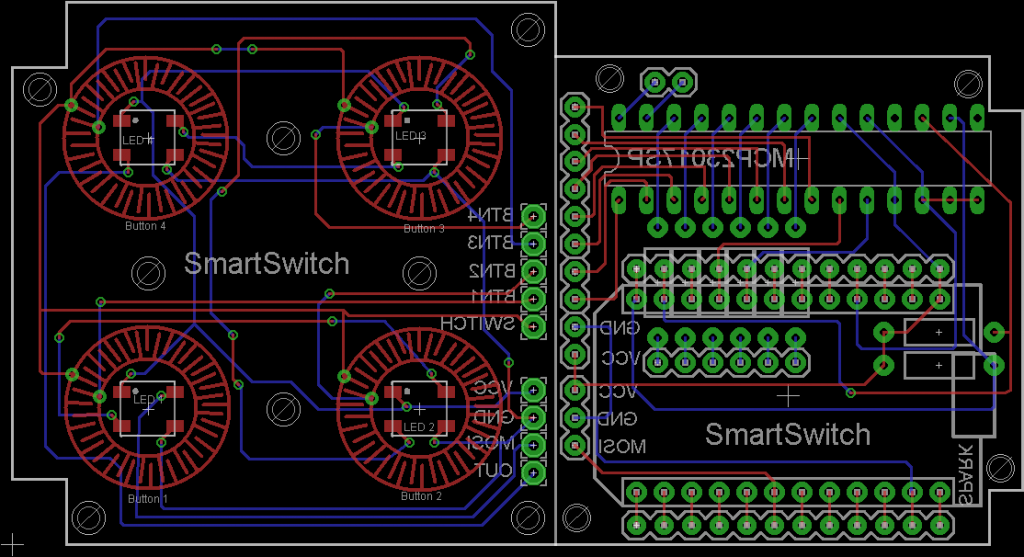
The goal was to develop an input device which can control local network components without the need to pull your smartphone out of your pocket by pressing a button. We implemented the neccessary software to process the button clicks and trigger HTTP requests in the local network. Additionally we produced a custom PCB. The project is open source and open hardware.
We published the project on hackster.io: www.hackster.io/hdm/smartswitch where it was on the Top Projects on February: http://www.hackster.io/blog/top-projects-feb-7
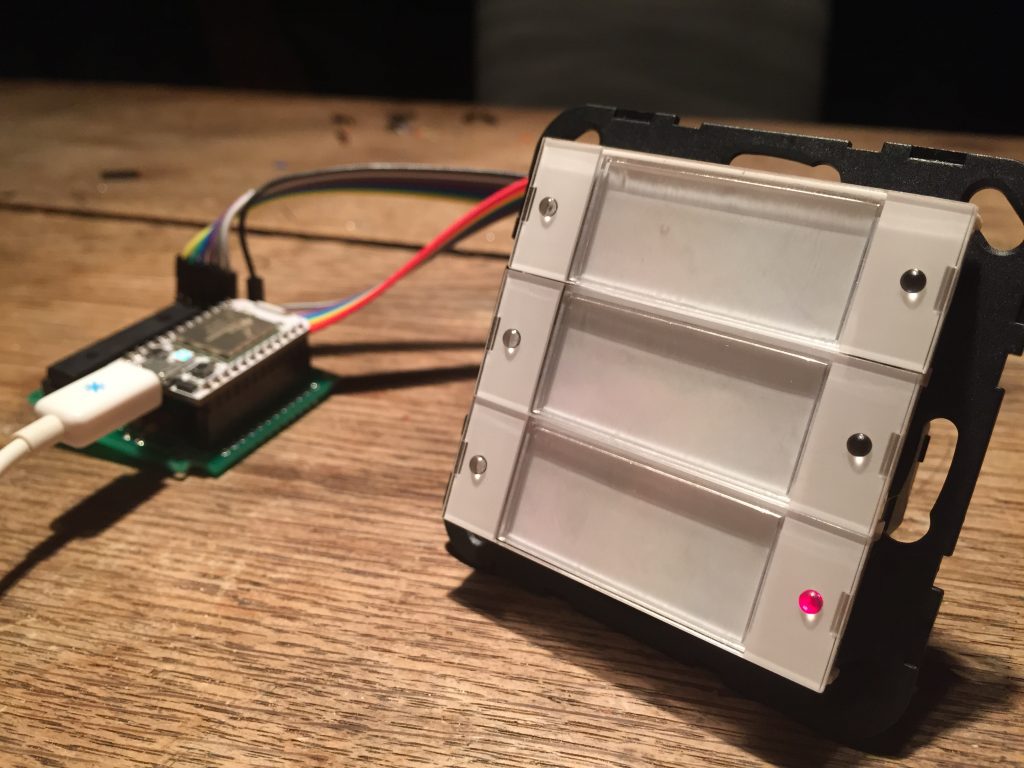
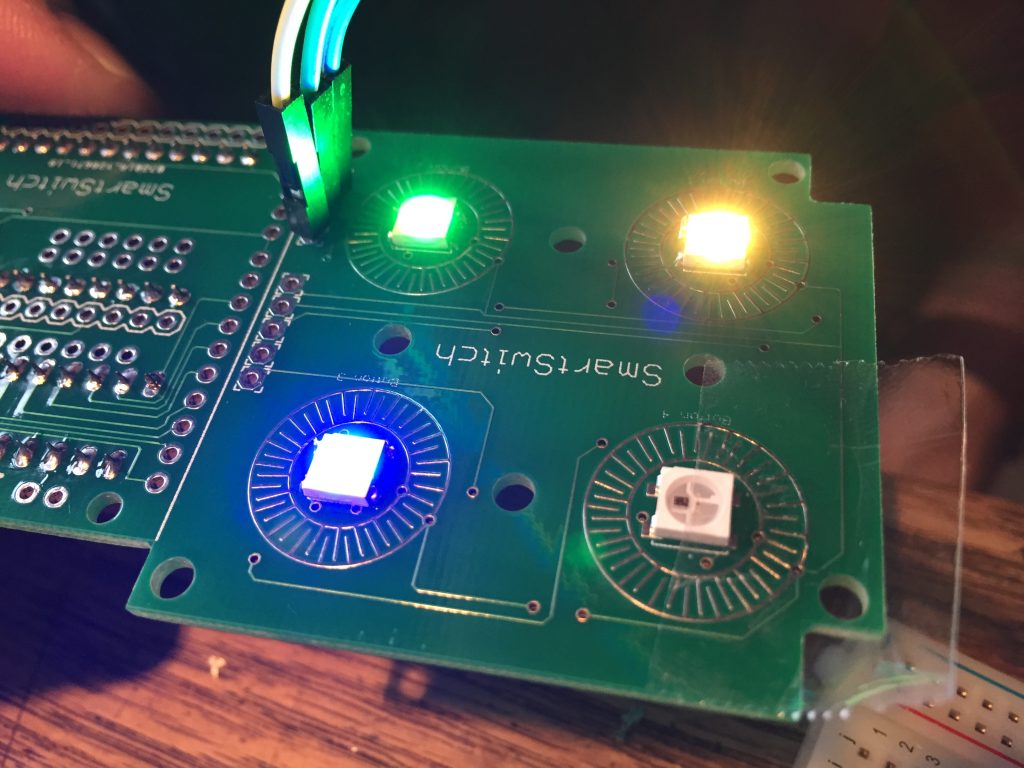
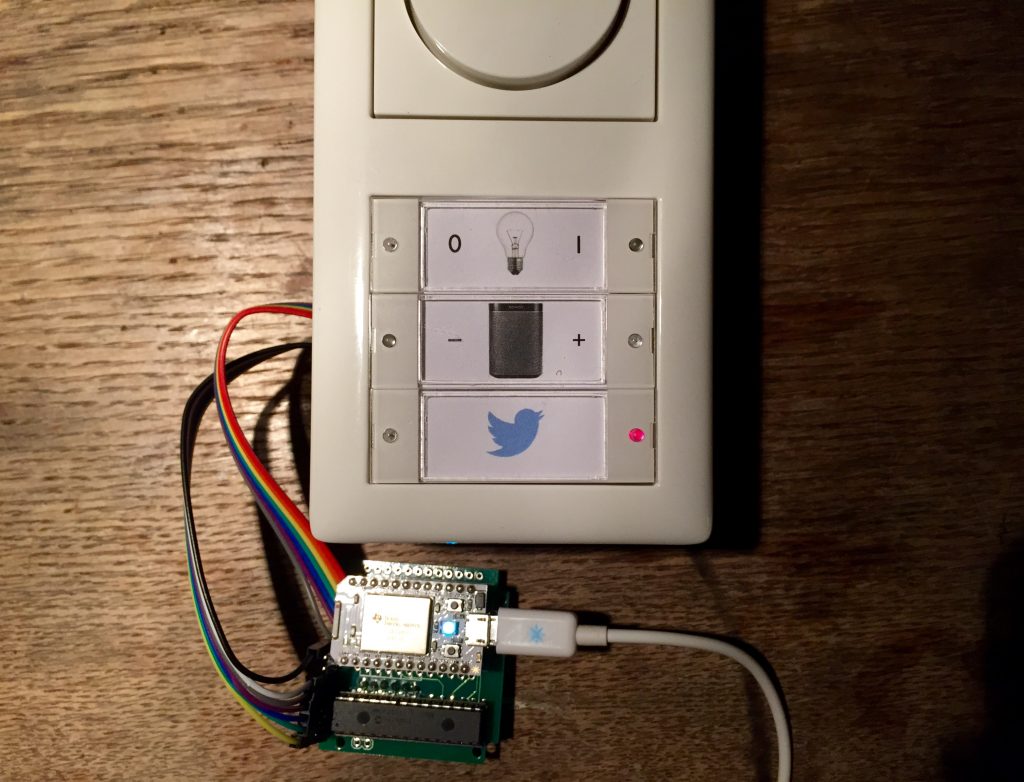
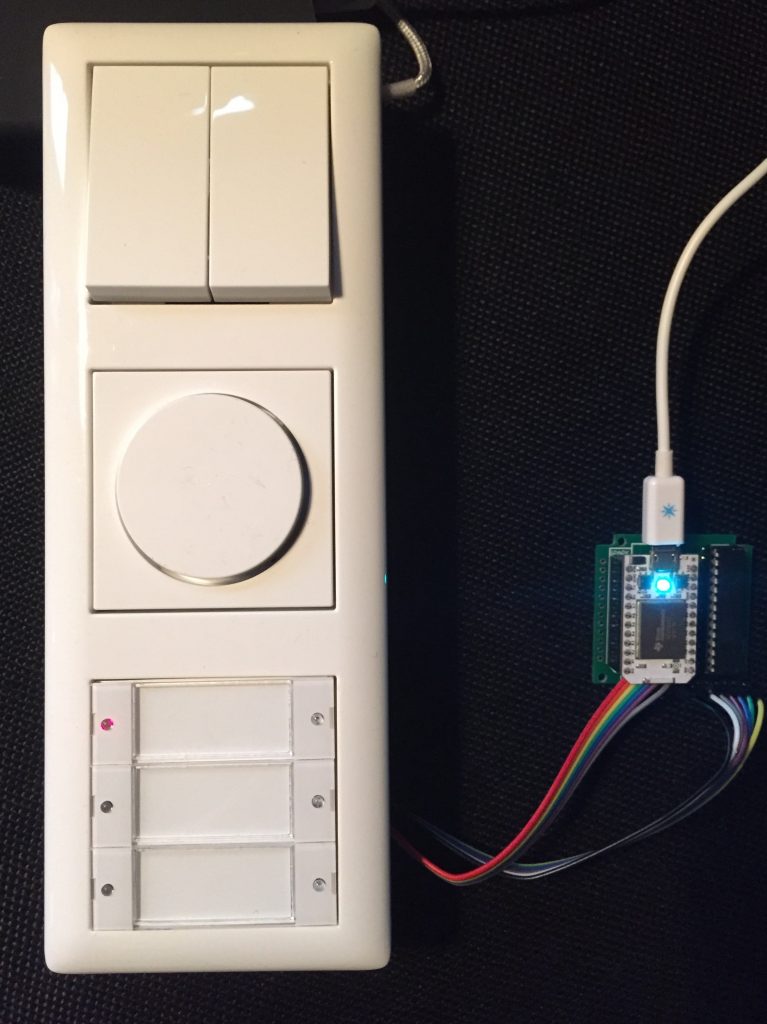
To increase the inputs we use a MCP23017 Port-Expander which is connected to the Spark in the following way:
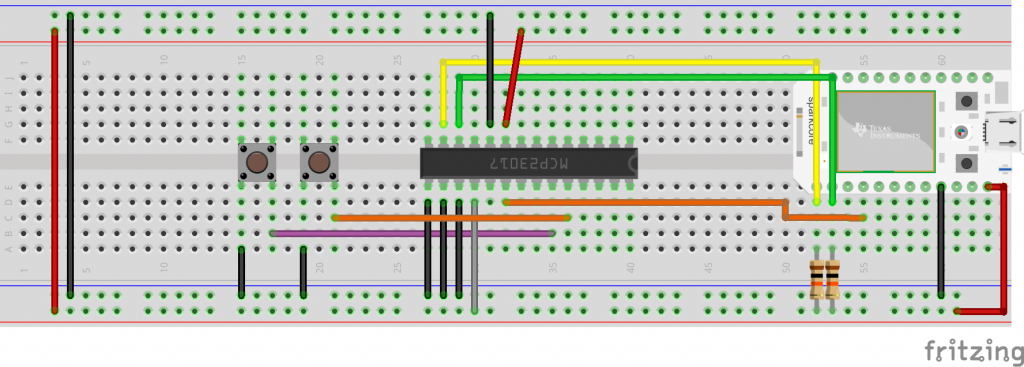
When pressing a button connected to the MCP23017 an interrup on the Spark Core is triggered.
While developing we had some problems with the interrupts on the MCP23017 and figured out that the MCP Interrupt Register must be read to recognize interrupts correct. That means after the initialization of the MCP and after the interrupt occurred it must be cleared with mcp.readGPIOAB(). (see our post: https://community.particle.io/t/mcp23017-library-port/6770/39)